 PRODRAFTSTATS™PRODRAFTSTATS™
The name at the top of a sorted list may not be there for the reason you think.
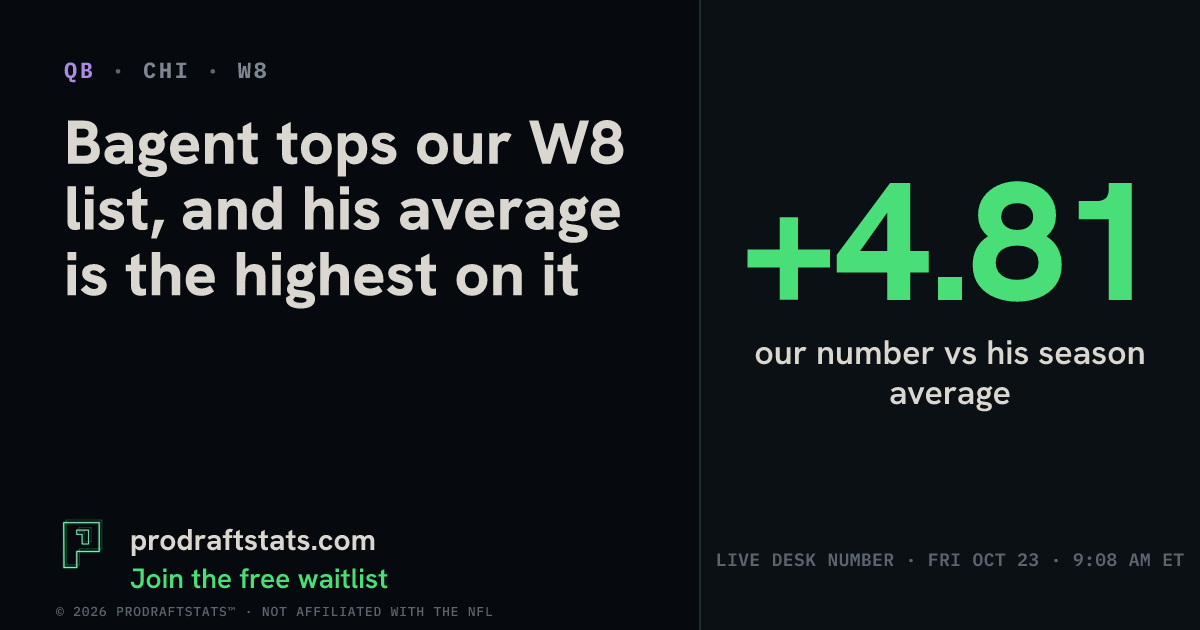
Tyson Bagent tops our Week 8 biggest-jump list at 8.86 against a 4.05 average, a 4.81 gap. That list ranks distance from a player's own average, not who scores most. Our data doesn't say he starts, and Week 8 desk numbers are live, not sealed.
Somebody in your league chat is about to post a list sorted by the biggest jump and treat the top name like a lock. Don’t be that guy. Our Week 8 list has Tyson Bagent (CHI QB) at number one, and nothing in our data says he is even starting.
So what does the list tell you? Four of the five names are there because their season averages sit near zero, which makes any decent number look big beside them. Bagent is the odd one out. His average is the highest of the five, and he still has the biggest jump. Why that happens is the whole trick to reading any sorted list, and you can use it on your next waiver claim. Our number for him is 8.86. His average is 4.05. Keep reading for what that gap does and doesn’t mean.
Bagent’s season average is 4.05 points per game. Our number for this week is 8.86 full-PPR points, so it sits 4.81 above his average. That distance is what the list ranks. It compares our number with Bagent’s own history, not with ESPN, a market, or how many leagues roster him. We have no ownership data at all.
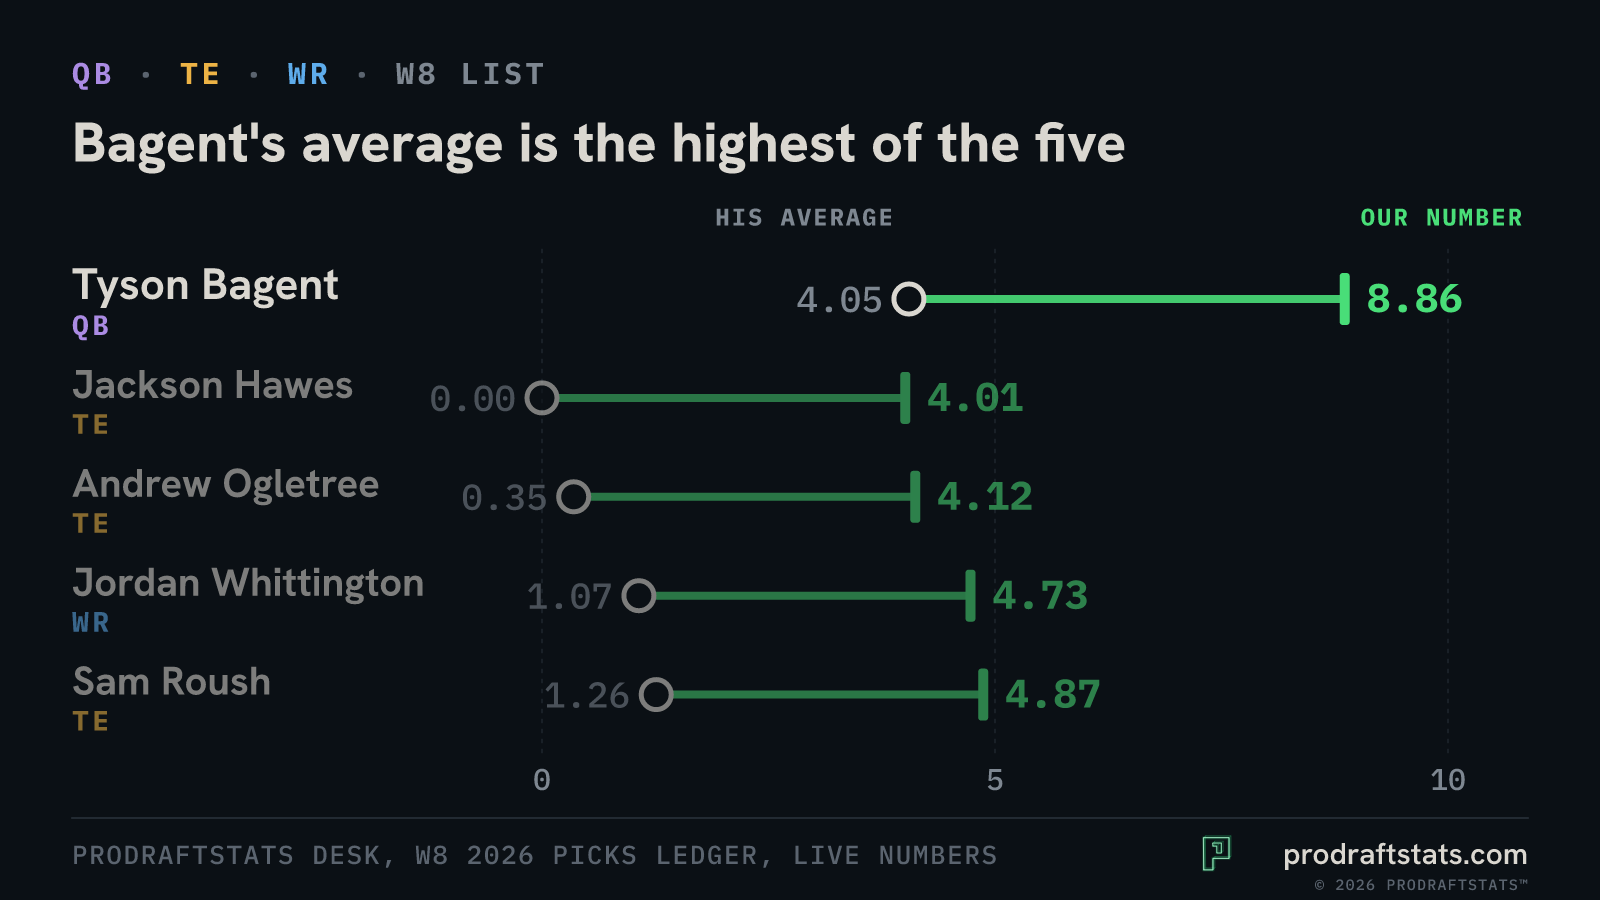
But look at the whole list before reading anything into the top spot. Four of the five players have season averages under 1.3 points, and one has 0.0. No projection on the list is above 8.86. Hawes at 4.01 and Roush at 4.87 sit on it with averages near zero, so even modest projections show a big jump.
That’s why the list is not a ranking of who will score the most. It ranks distance from each player’s own average. For the other four, a near-zero average makes the gap easy to reach. Bagent is the exception, and that is the interesting part.
Here’s the catch: a big distance feels like upside. That feeling is anchoring, where a low reference number can make a modest projection look large. For Bagent that explanation fits poorly, because his 4.05 is the highest average of the five. Our number for him has also been steady: 9.14 in the sealed Week 7 table and a live 8.86 now, both more than double his average.
A projection is a central estimate for one week. His actual score can land well above or below 8.86, so expect a spread around it rather than a point. Whether he plays at all is a separate question, and our data does not answer it.
Because the card is not a depth chart, check Bagent’s status from your own sources. Our Week 8 data does not say he is starting, and it carries no injury news. If he is under center, the 8.86 is one central estimate; we don’t publish a spread for it here, and his actual score can land well above or below. Whether it helps depends on your matchup: a favourite wants the steadier outcome, an underdog can use the variance. Our start/sit tool aims to maximise your chance of winning the matchup, not raw points. The choice is yours, and nothing on this page is a lineup instruction.
These are also live numbers, not yet sealed as of Saturday, October 24. There are no 2026 results yet, so we can’t say whether the projection was close.
Send this to the person in your superflex league who sorts every list by the biggest number.
Source: ProDraftStats desk.
It measures how far our number sits above a player's own season average. It is not a comparison with ESPN, a market, or ownership. For Bagent it is 8.86 versus 4.05, a 4.81 gap. These are live Week 8 numbers, not yet sealed.
Our Week 8 data does not say, and it carries no injury news. The value gap card is not tied to the depth chart, so check his status from your own sources.
Four of the five players have season averages under 1.3 points, and one has 0.0. Against a near-zero average, even a modest projection like Hawes at 4.01 or Roush at 4.87 looks like a big jump.
ProDraftStats launches in 2027. Join the free waitlist.